
How we operate today
Secure Trust Bank is an equal pay employer and is proud of the professional colleagues who work hard to deliver an exceptional service to our customers and business partners. Similar to the wider Financial Services sector, our Gender Pay Gap is primarily driven by the under-representation of women in senior roles and a higher concentration of women in more junior positions. We have seen a year-on-year improvement in female representation at senior levels and are committed to continuing this progress.
Why we have a Gender Pay Gap
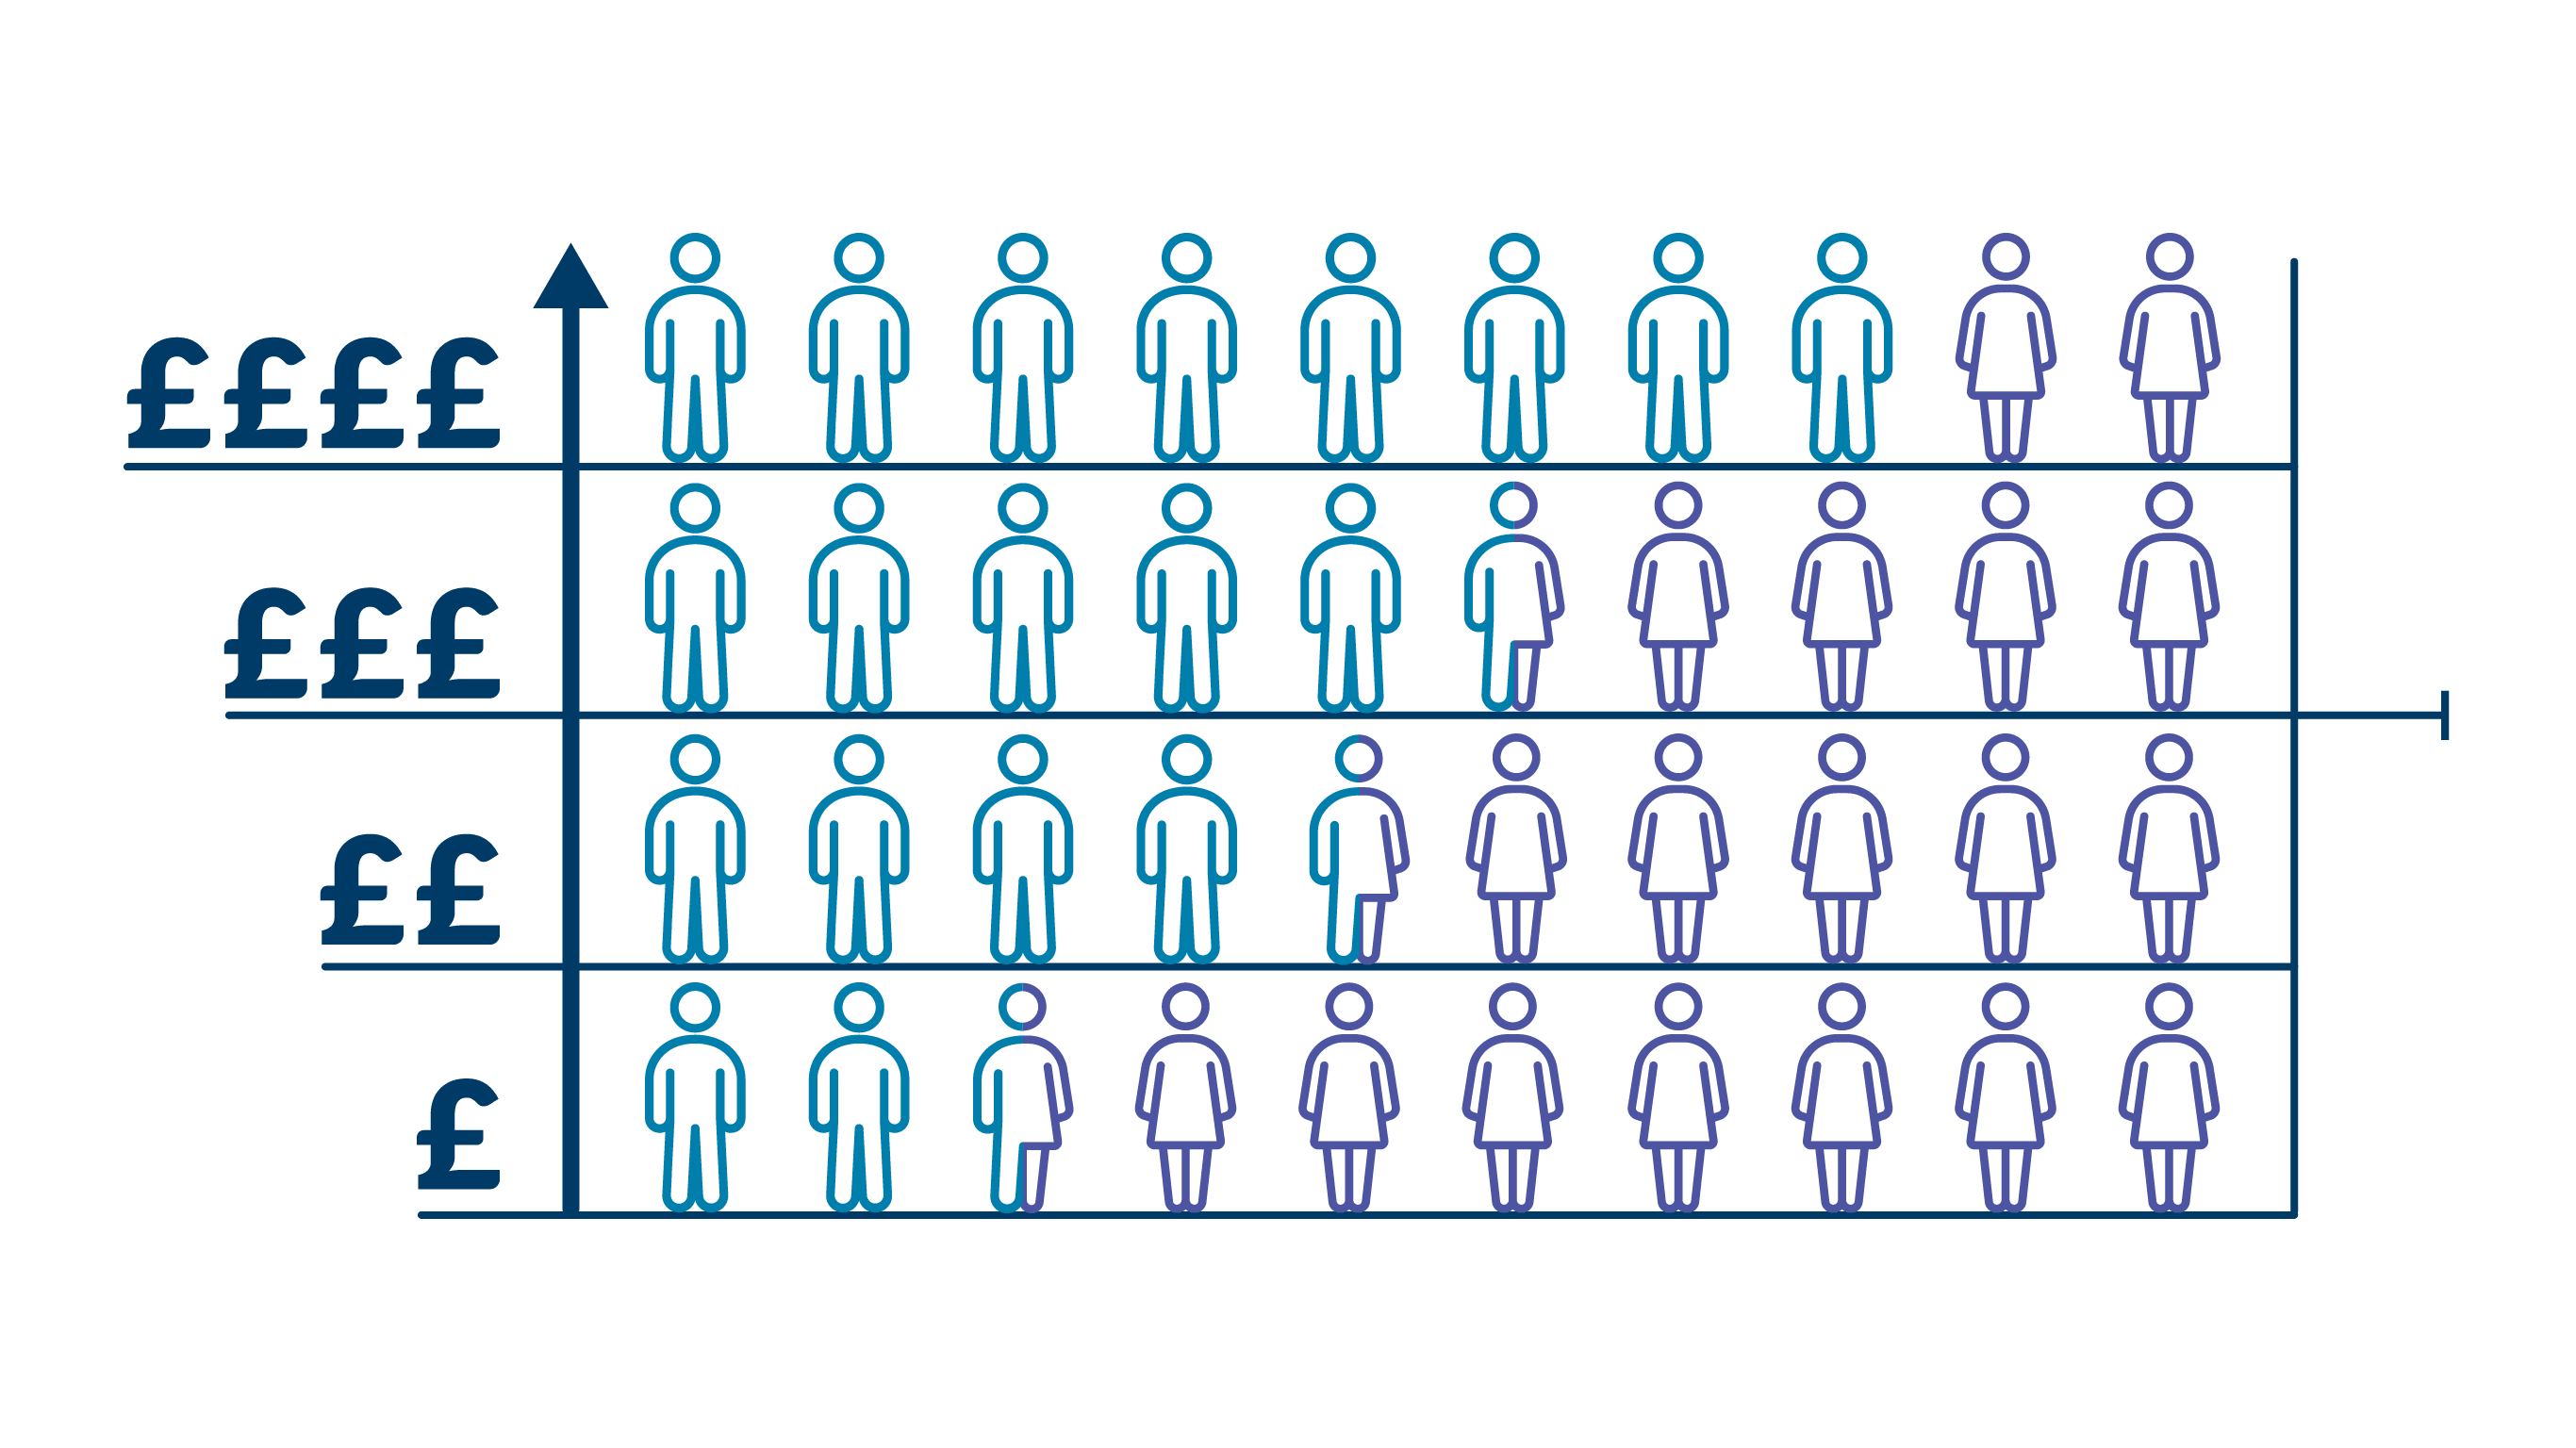
Our gender ratio is effectively 1:1 male to female, but breaking this down into three tiers highlights the situation more succinctly.
| Per Category | Male to Female Ratio |
|---|---|
| Customer Facing & Support | 2:3 |
| Management & Specialists | 3:2 |
| Leadership | 2:1 |
| Total | 1:1 |
Gender Pay Gap figures look at pay in the organisation from top to bottom, removing any notion of seniority, length of service, or specialism. A Gender Pay Gap can only be truly closed when we have the same gender ratio at all levels of the business. This underlying mathematics is the basis of the Gender Pay Gap at Secure Trust Bank rather than any indication of inequality in male and female pay in the same role.
Constraints in 2025
Significant organisational change in 2025 brought both progress and challenges. While restructuring improved senior-level diversity metrics, it disrupted continuity in some initiatives and affected engagement scores. Despite this, we maintained external recognition and advanced work to refresh our ED&I strategy which we anticipate will have a positive impact on future Pay Gap reporting.
What we did in 2025
In 2025 we focused on actions aimed at improving progression and representation at senior levels. This included maintaining diverse shortlists for senior roles, strengthening internal talent development, and refreshing our career progression frameworks.
We undertook a comprehensive refresh of our ED&I strategy, informed by colleague feedback, to ensure it addresses structural barriers to progression. Investment continued in leadership and capability development through the relaunch of the Management Development Programme, expanded experiential learning, and renewed focus on mentoring and sponsorship.
These actions were supported by continued work to embed inclusion and fairness across the organisation including external benchmarking and colleague engagement activity, providing a strong foundation for future progress.
Looking Ahead
In 2026, our focus will be on addressing the structural drivers of our Gender Pay Gap by committing to a fair, transparent and inclusive pay, benefits and reward approach. We will continue to use independent pay benchmarking to ensure females and males in the same role are comparative and any differentials are not gender based.
We will strengthen leadership engagement, improve progression pathways, and continue to embed inclusion across the organisation. This includes expansion of mentoring and coaching to support career progression, and investment in clear career pathways and development opportunities to strengthen succession readiness. The three-year goal is to undertake these additional initiatives to improve the attraction of vacancies to a wider female audience, with a focus on senior and technical roles.
Our 2025/26 Gender Pay Gap Results
These figures relate to Secure Trust Bank only as V12 Retail Finance is not currently included in government reporting requirements.
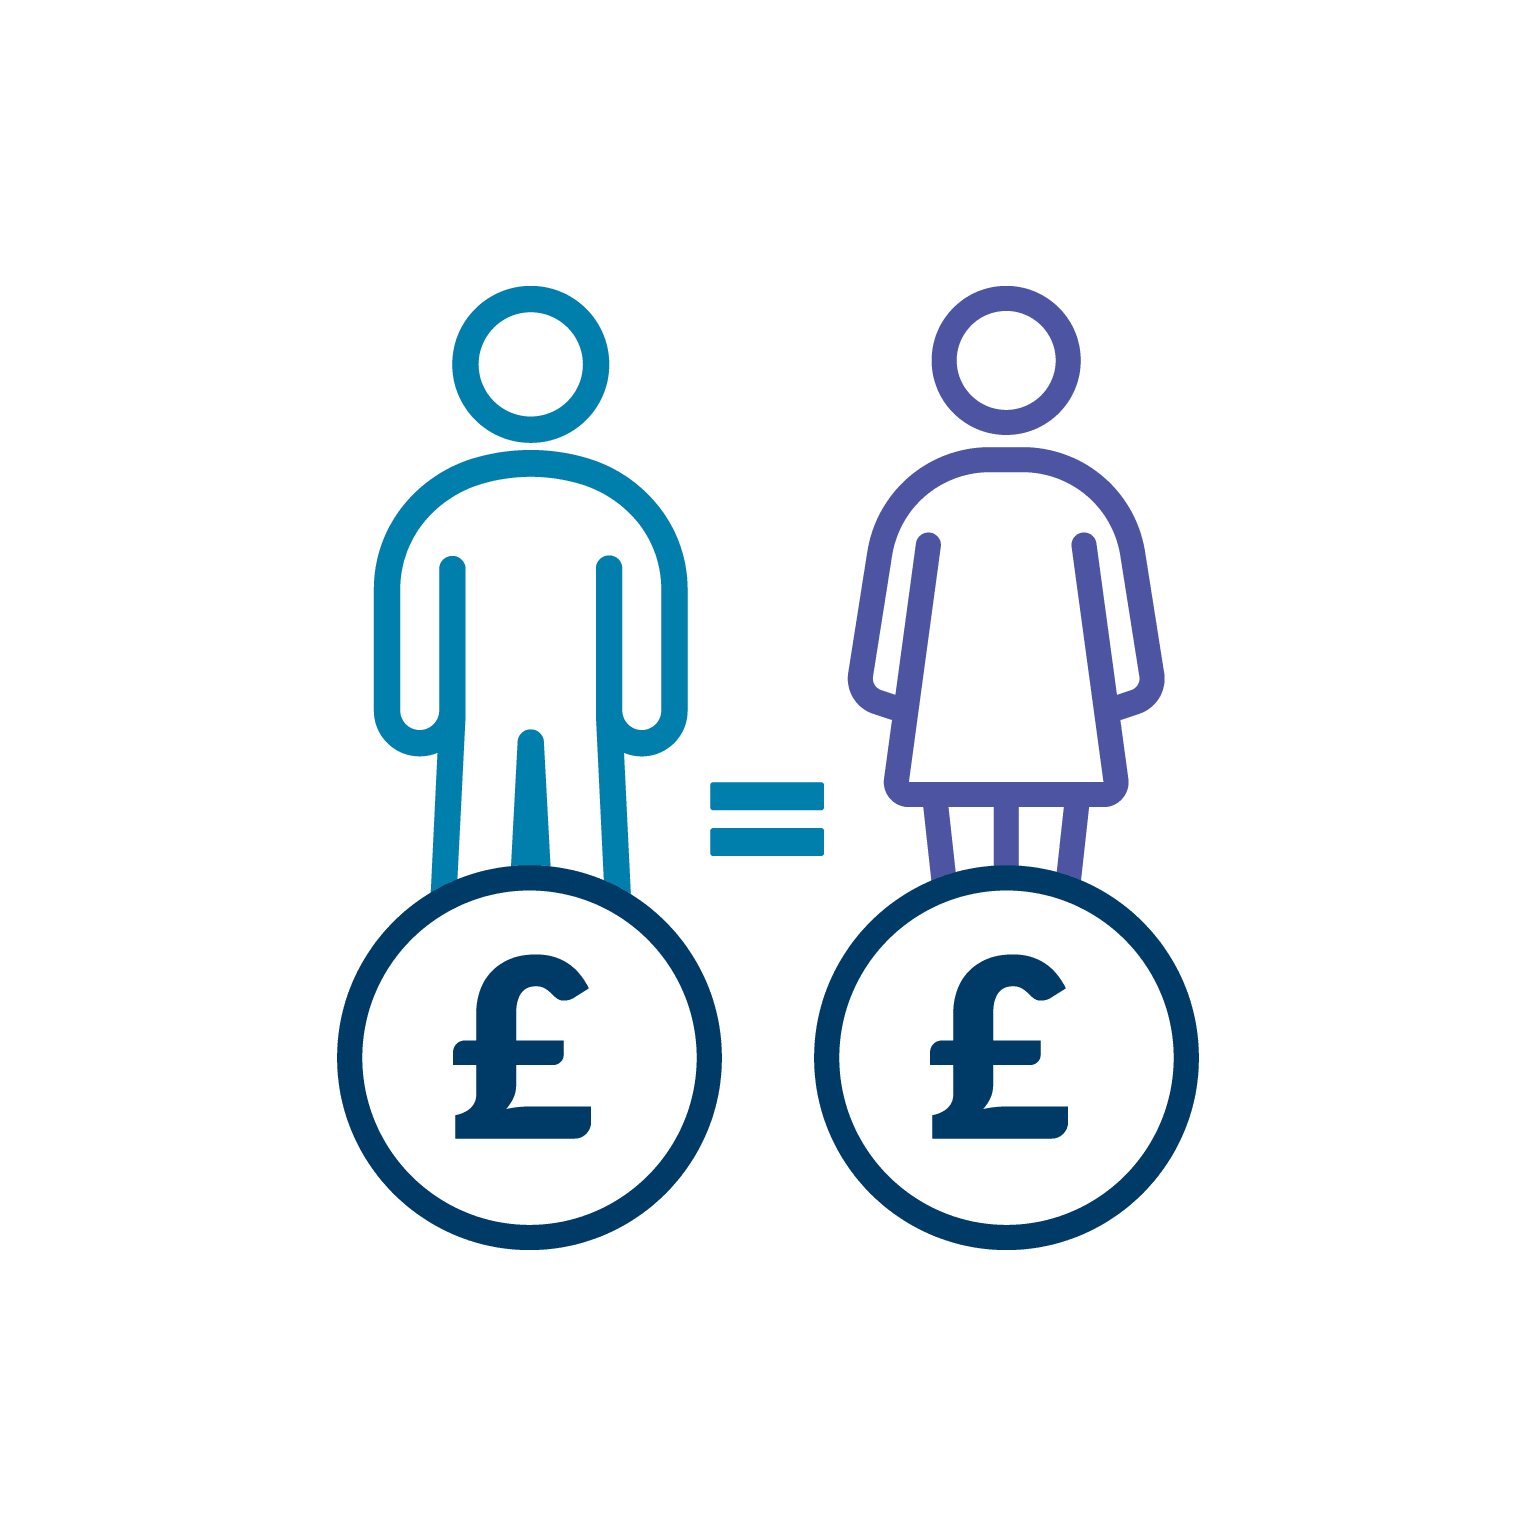
Equal pay
Men and women being paid the same for the same work.
The Gender Pay Gap
The difference between total hourly earnings for all men when compared to the total hourly earnings of all women within an organisation.
Nationally, one of the main reasons for the Gender Pay Gap is that men are more likely to be in senior roles. As with other Financial Services companies this is the case at STB.
How is the Gender Pay Gap calculated?
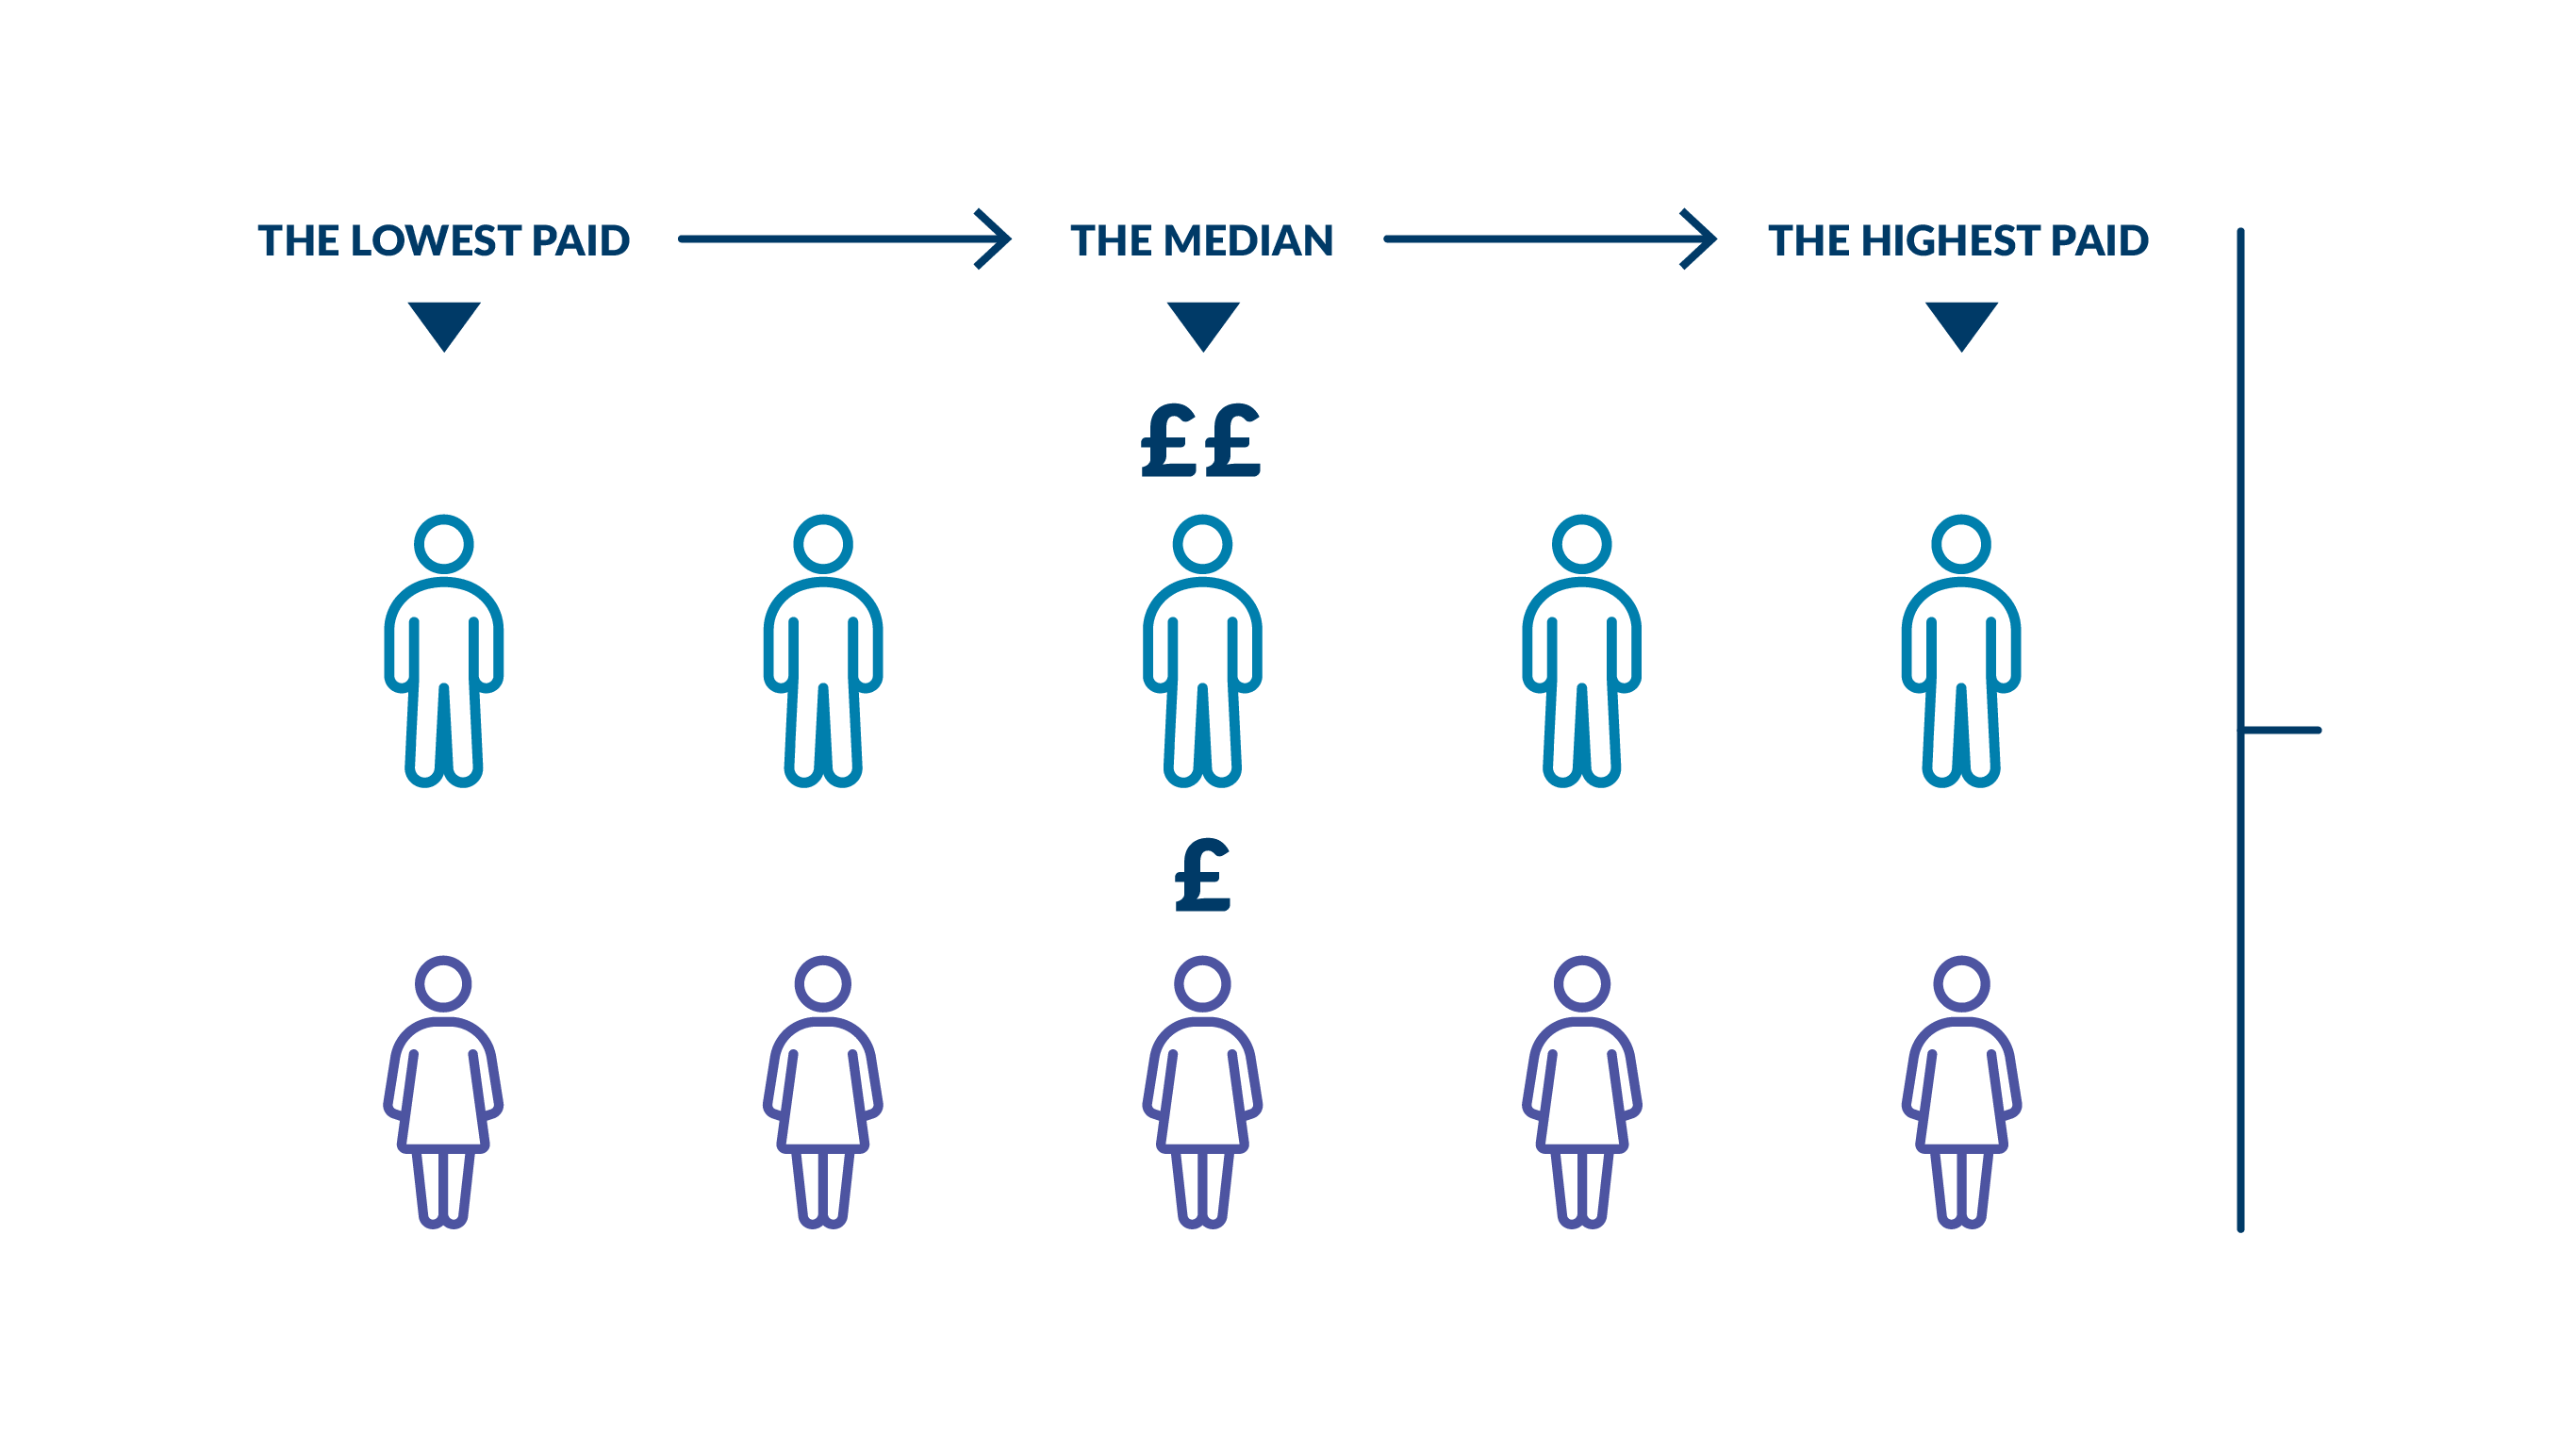
The STB median Gender Pay Gap is 39.9%
The STB average Gender Pay Gap is 37.6%
Results for Secure Trust Bank
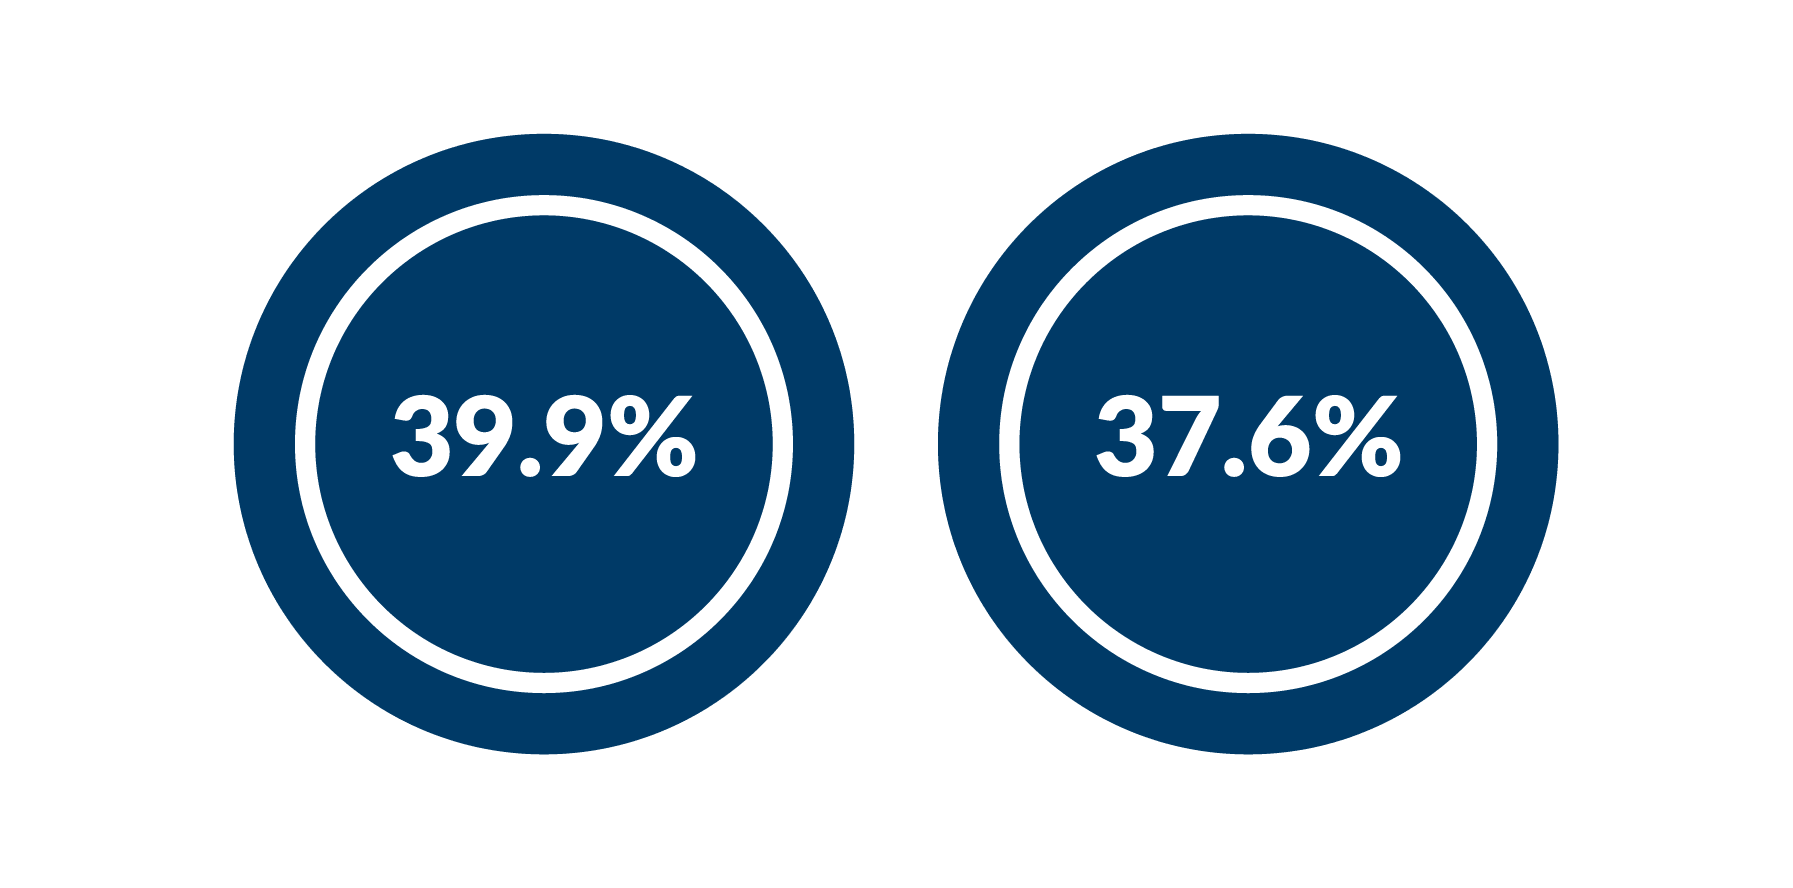
Gender Pay Gap median 39.9%
Gender Pay Gap average 37.6%
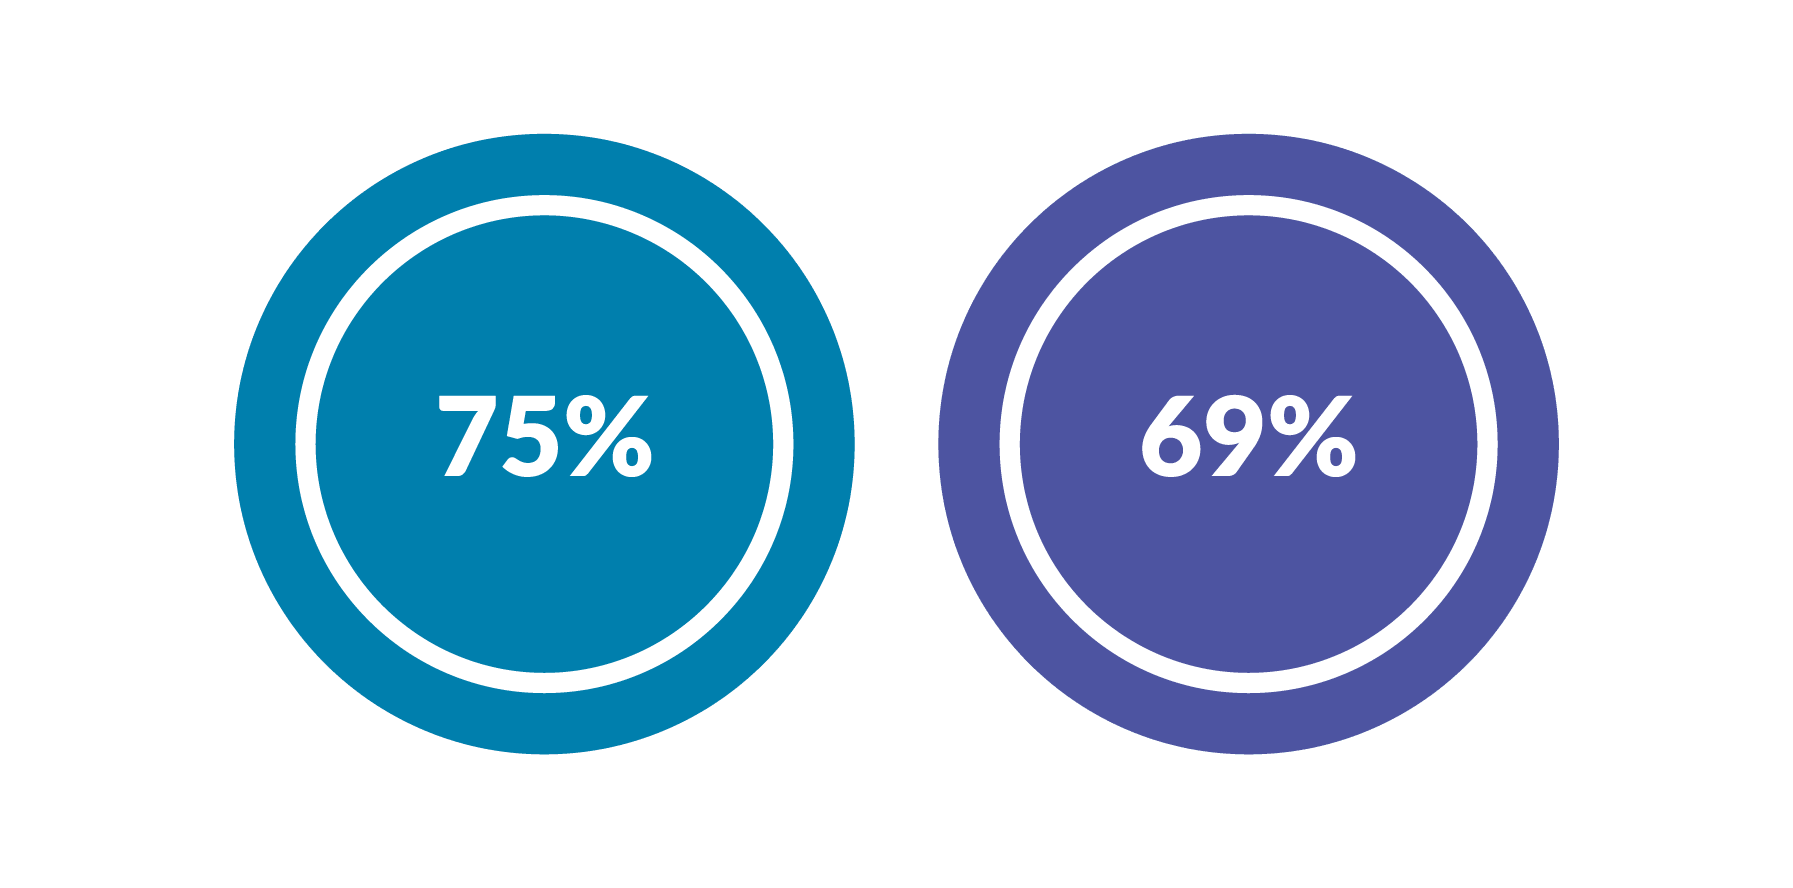
75% men received bonus
69% women received bonus
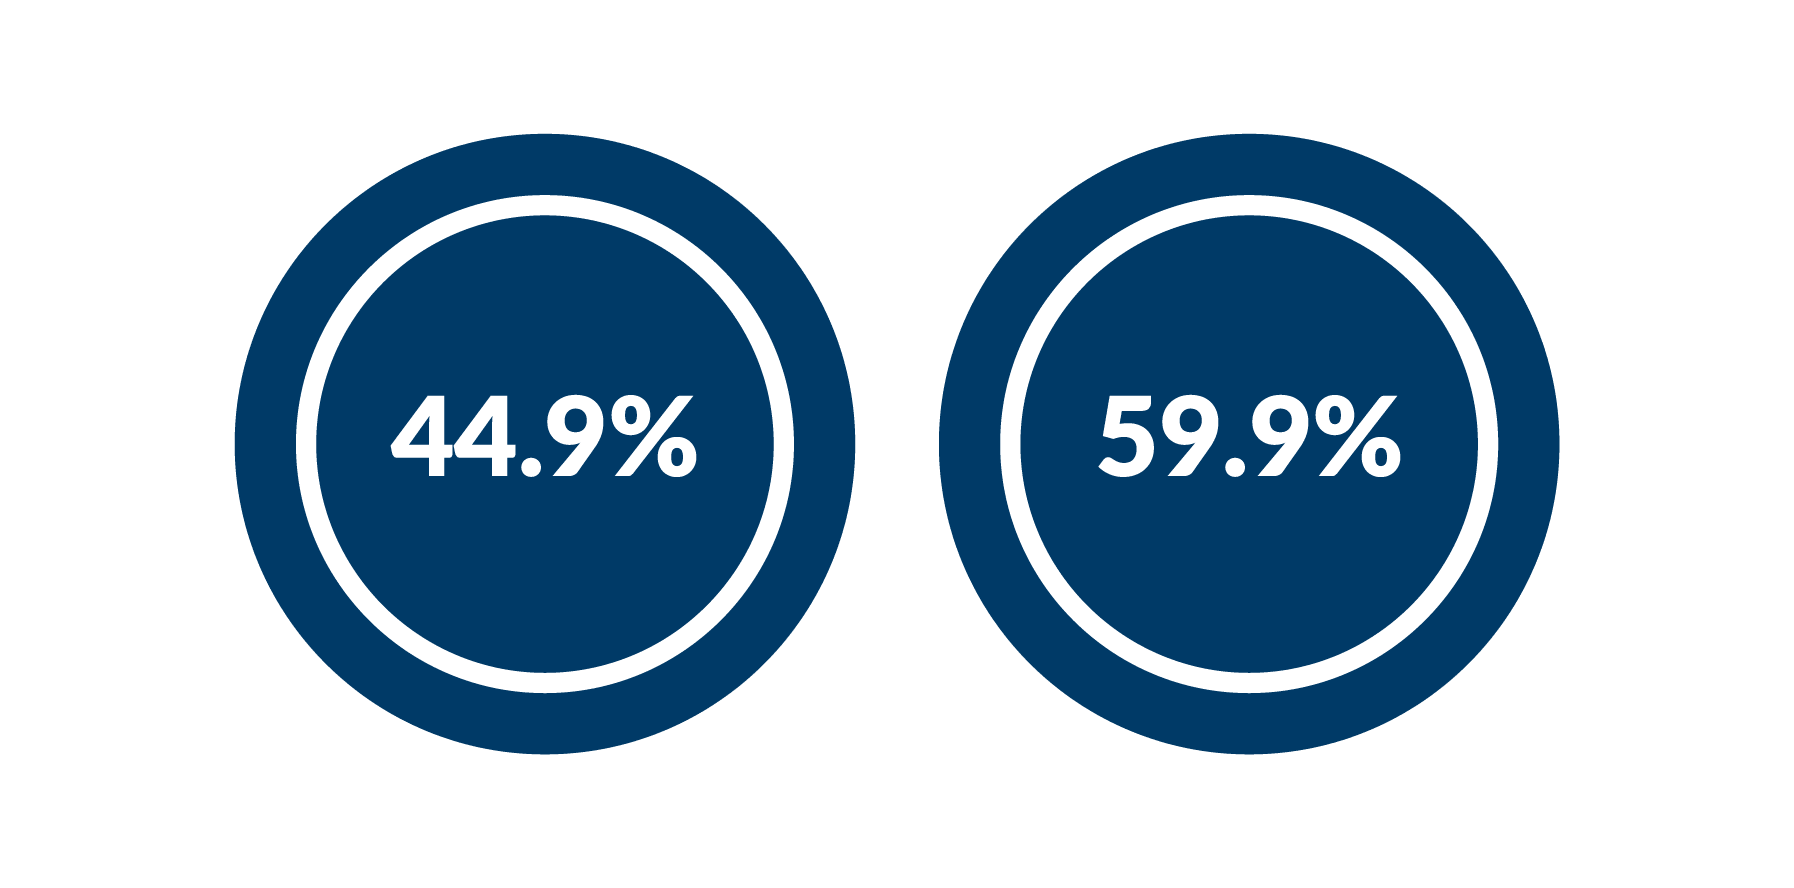
Bonus Pay Gap median 44.9%
Bonus Pay Gap average 59.9%
Gender representation by pay quartiles
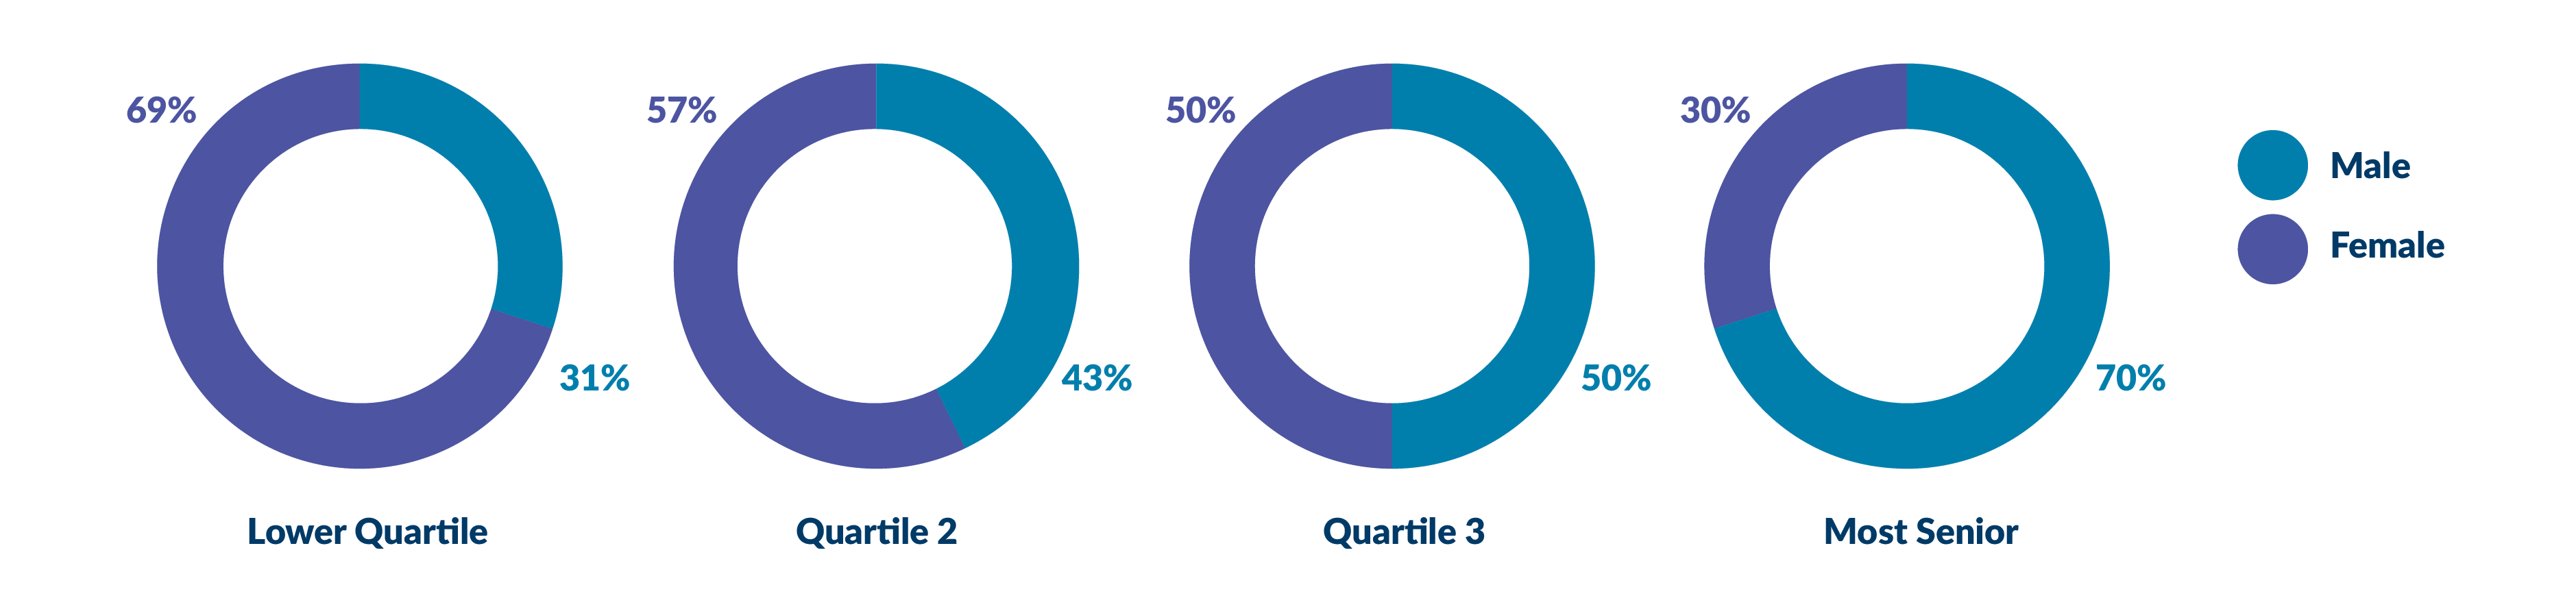
| Quartile | Lower | Q2 | Q3 | Most Senior |
|---|---|---|---|---|
| Female | 69% | 57% | 50% | 30% |
| Male | 31% | 43% | 50% | 70% |